
Marketing dashboard
The marketing dashboard shows how visitors navigate your configurator, where they drop off, and which technologies they use. It requires tracking to be enabled on the product.
Where to find it
Manager → Marketing → Dashboard.
The page needs the manage → analytics permission — see User settings.
Filters & loading a report
Use the filter bar to segment the data:
- Product — the configurator to analyse. Only live products are listed.
- Period — a date range, or a quick preset (7d, 30d, 90d) in the date window.
- Segments — optionally filter by device, browser, or dealer.
Click Get report to fetch the data.
The report only counts sessions that lasted between 1 and 60 minutes; shorter and longer sessions are left out.

Reading the dashboard
Step funnel
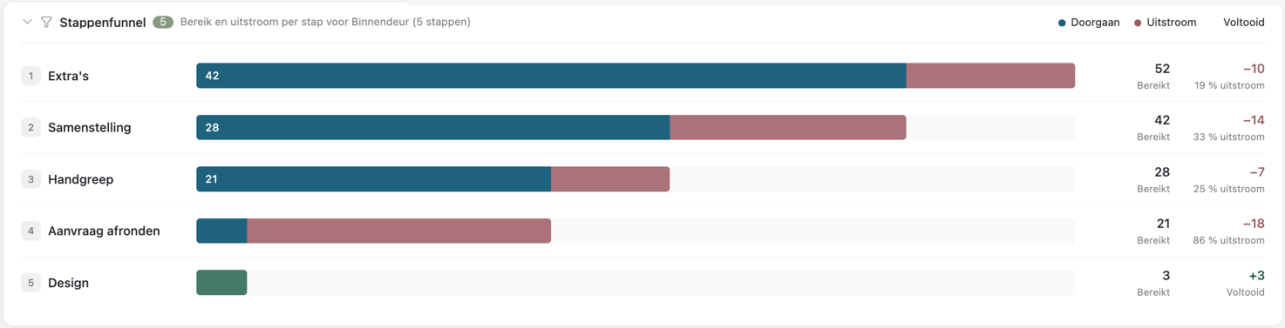
Shows how many users continue per configuration step and where they leave:
- Continued (blue) — users who advanced to the next step.
- Drop-off (red) — share and count of users who left at that step. Reveals which steps are too complex and need optimisation.
- Completed (green) — on the last step, users who submitted.
Key KPIs
- Sessions — total configurator visits.
- Conversions — users who reached and completed the final (lead-capture) step.
- Conversion rate — conversions as a percentage of all sessions.
- Avg loading — seconds to first interaction (UX/SEO relevant).
- Avg session — lowest and highest daily average time spent in the configurator.

Sessions over time
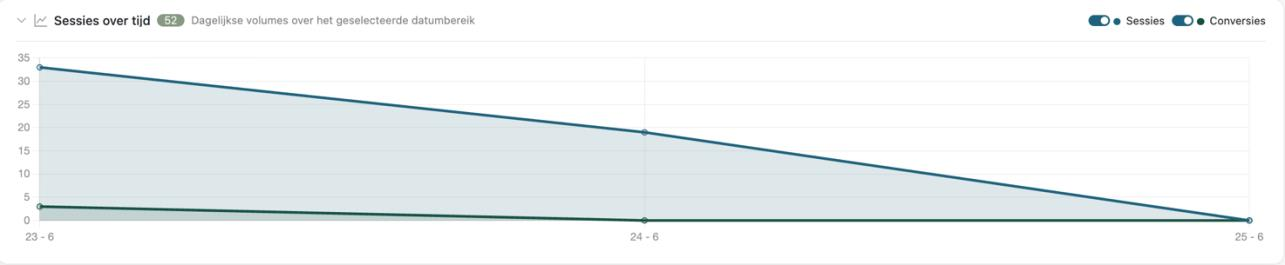
Daily session and conversion volumes plotted to spot trends and peaks across the date range. Use the toggles next to Sessions and Conversions to show or hide each line.
Audience
Share of sessions per technology:
- Browser — e.g. Chrome, Edge, Safari, in-app browsers (Instagram, Facebook).
- Device — Desktop, Smartphone, Tablet.

Enable tracking
Without tracking there is no data to show. Switch it on per product:
Manager → Configurations → open the product → Submission & tracking → Enable tracking to get insights.
Save the product. New sessions are recorded from that moment; sessions from before are unaffected, so a freshly enabled product stays empty for a while.
iConfigure then records each configurator session: steps visited, features changed, time per feature, device and browser, and whether the visitor finished. Dealer-scoped views apply automatically when you look at a dealer product.
What is stored
Each tracking row includes:
{
  user: { device, browser, os },
  product_id,
  company_id,
  dealer_id,
  email,
  finished: false,
  time: { loading, total },
  updates: [
    {
      step: 0,
      changedFeature: 'material',
      value: 'oak',
      time: 1718630000000,
      timeSpentOnFeature: 4500,
      totalPrice: 1200
    }
  ]
}
Updates append as the user configures and moves between steps; finished becomes true on successful submit and email is filled with the visitor's email address.
Export raw data
Manager → Data → Export → table tracking → export CSV for BI or offline analysis.
Google Tag Manager (host page)
Internal Manager analytics are separate from GTM on your website. For marketing tags on your domain: enable tracking, use Script inject, define dataLayer (GTM snippet) before injectApp(), then listen for ic_setup, ic_step, ic_form_show, ic_update, and ic_finish. See Analytics & GTM for debounce rules and which widgets emit ic_update today.
See Analytics & GTM.
Privacy
Ensure your privacy policy covers configuration analytics. Tracking stores interaction metadata, not form PII, until the user submits contact details. On submit, the visitor's email address is also saved on the tracking session; the other contact details are stored on the quotation only.